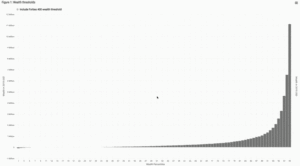
Most social scientists tend to measure wealth inequality by studying wealth concentration at the very top, or by describing the distribution of wealth across the rest of the population. It can be difficult to consider and view both aspects of wealth inequality at the same time.
To help see and understand the full spectrum of wealth inequality, CID Director Fabian Pfeffer and CID Graduate Student Fellow Asher Dvir-Djerassi, PhD candidate in Public Policy and Sociology, created an interactive visualization of the U.S. wealth distribution based on the 2019 Survey of Consumer Finances and the Forbes 400.
The tool was published by Socius and is now available here.
“Utilizing a visualization tool like this lends itself to something a traditional academic paper doesn’t,” Asher explained. “ It gives the user the ability to see the full complexity of the distribution.”
The challenge lies in the scale.
Despite having done research on wealth for a long time, Fabian said he struggled to develop an intuitive understanding of just how extreme wealth inequality is at the very top. “When we first looked at the visualization for the first time, I clicked on the Forbes 400 and went, wow.”
“You need to see it to fully appreciate the degree of wealth inequality in this country – it’s just off the charts.”
It is important to jointly display and conceptually relate the fact that one in 10 U.S. households (or, about 13.4 million households) have negative wealth, while a few hundred families hold wealth that towers over even the wealth at the 99th percentile, Pfeffer explained. “After all, these two aspects of wealth inequality may not be unrelated to each other.”
“People don’t like to talk about zero sum games but the fact is that an increasing share of the population is in debt or has no assets and a very small segment of the population is increasing their wealth. One extreme doesn’t exist without the other. Those things may be tied together – there may be a reason why that occurs – that’s what we’re hinting at.”
Fabian and Asher said they plan to look further into these relationships and explore more of the theoretical work to bring a social scientific perspective to the relational aspects of inequality.
“We’re drafting a paper that looks precisely at wealth from a relational perspective: one person’s asset is another’s debt; the accretion of wealth for one person, implies that another has fewer claims on economic resources” Asher said. “This more conceptual thesis is in many ways visualized in this interactive tool.”

